Drawing tools
The drawing tools allow you to annotate your map with text and shapes. All drawings are saved to Places, where they can be edited for position, size, colour, and labelling.
The introduction of the sketch widget has brought about distinctions in behaviour between 2D and 3D places. For further details, please consult the information on 3D places.
- Editable 2D places, when observed in 3D or 360 modes, will conform to the terrain and automatically adopt the elevation mode defined as On the ground.
- In contrast, places created in 3D or 360 modes have the option to apply elevation. While 3D places can be edited in 3D mode, editing places within 360 mode is not supported.
- The examples provided in this section pertain to the drawing and editing of 2D objects.
Drawing tools and editing places
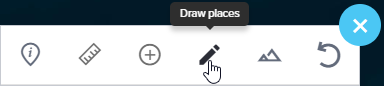
Select the Spanner tool (top right) to pop out the toolbar to use a drawing tool.

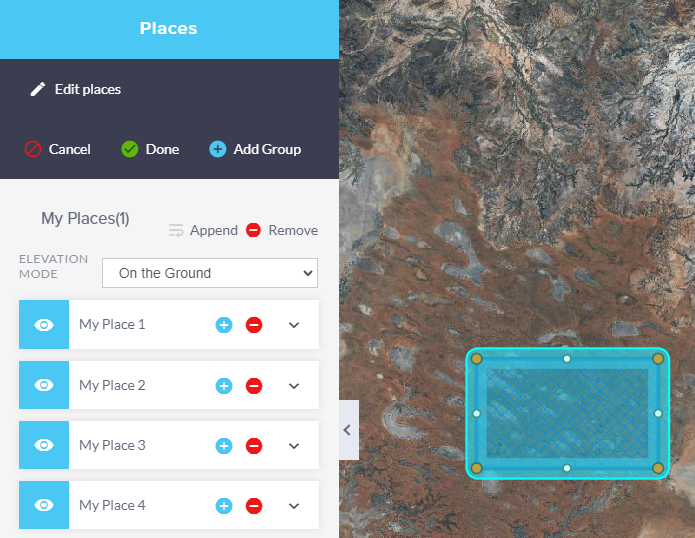
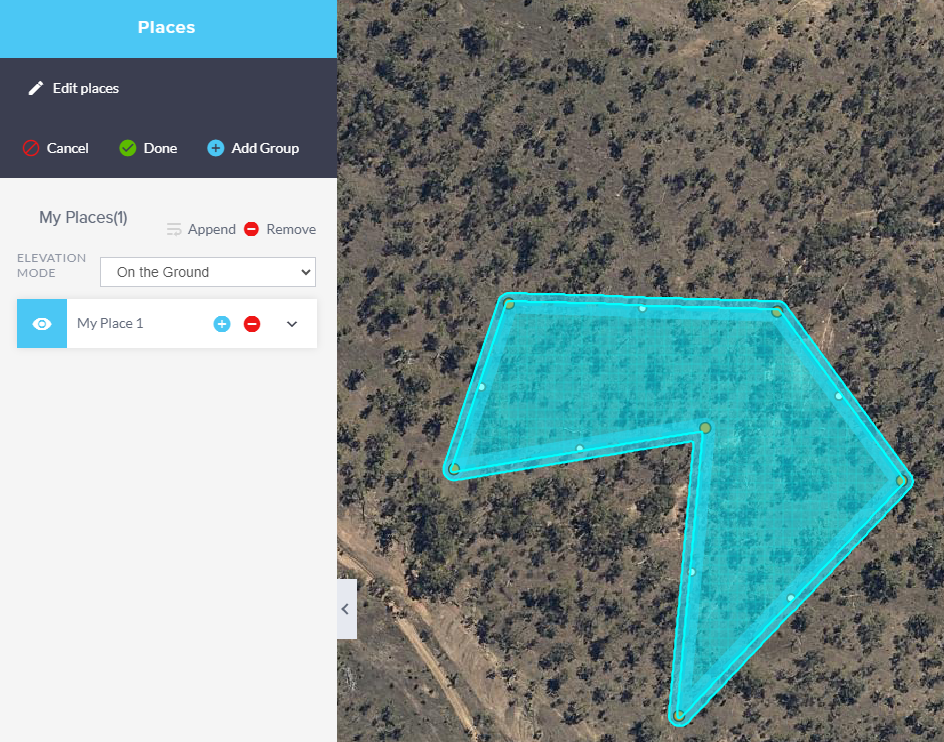
To edit an existing Place, navigate to the Places menu tab on the left, then click Edit places.
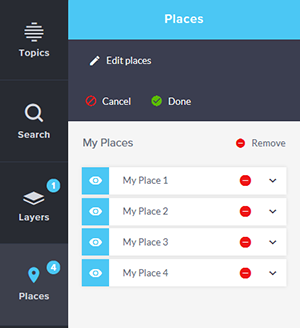
While editing, you can remove a Place individually or by groups at a time and modify the size and position of selected Places.
Draw and edit a point
To begin drawing, select Draw Places from the Toolbar menu.
Select Draw point from the list of options.
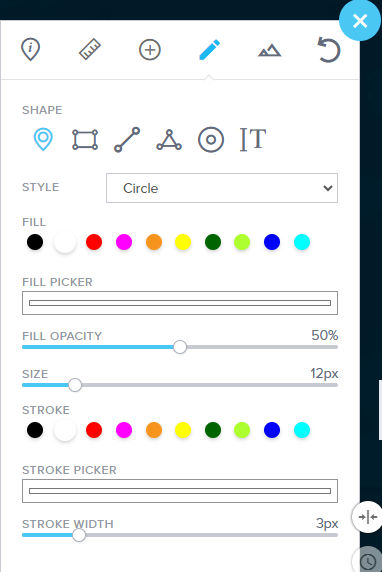
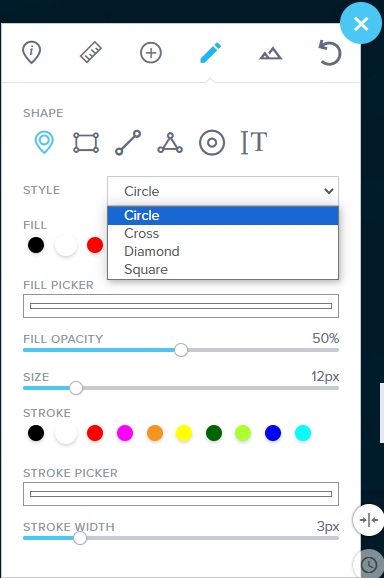
Choose the type of point you would like.
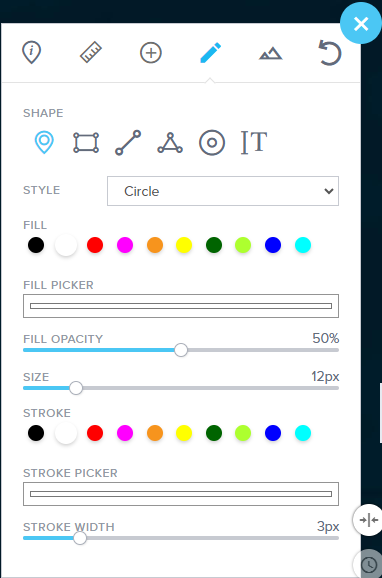
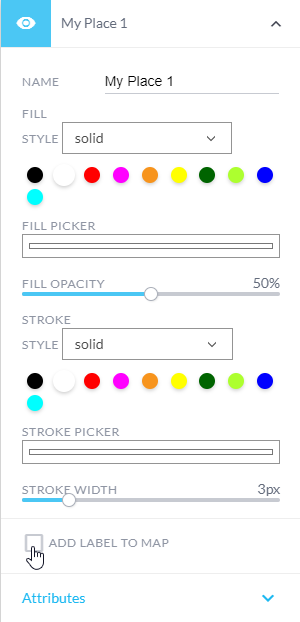
Before you click to place a point, you can change options for the fill and outline colour, stroke colour and stroke width.
Once you are happy with your selection, click on the map where the point should be placed, it will be drawn on the map will also be added to Places.
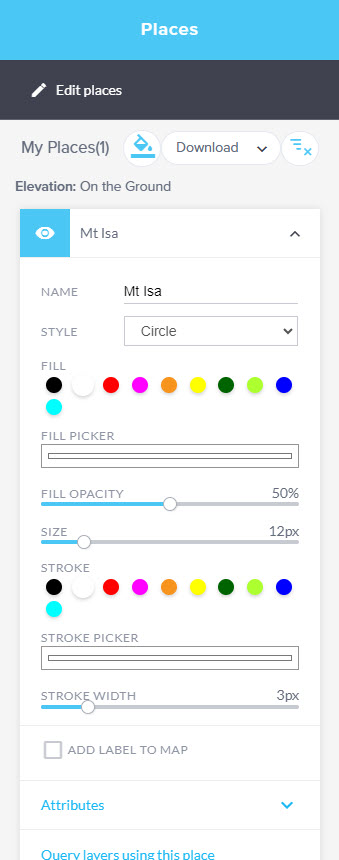
Navigating to Places and selecting Edit places allows you to edit the location of your point after you select it.
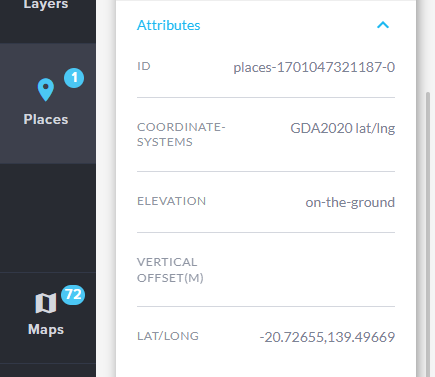
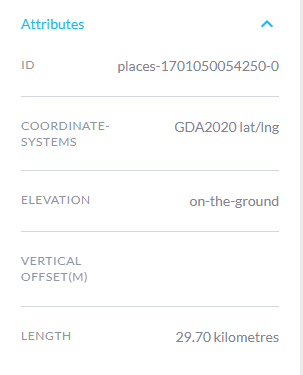
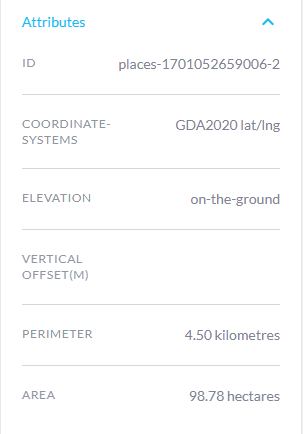
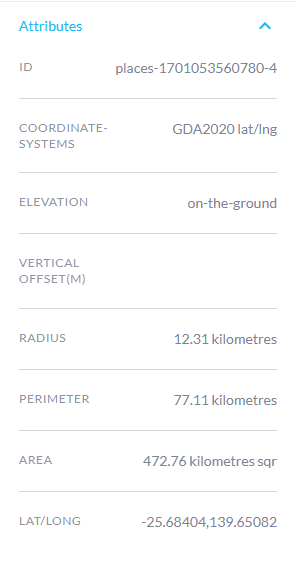
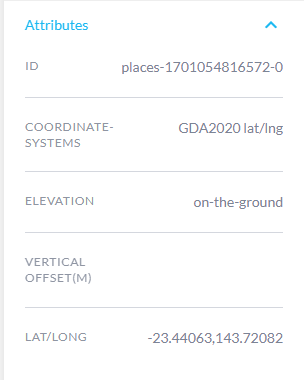
Any changes to the Point can be found under its Attributes.
Draw and edit a rectangle
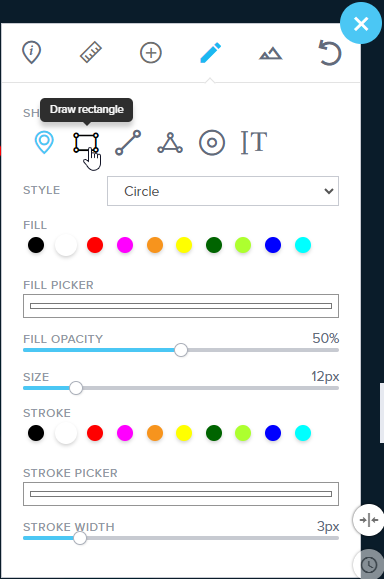
Select Draw rectangle from the list of options.
Before you click to draw, you can change options for the fill colour and opacity, stroke colour and width.
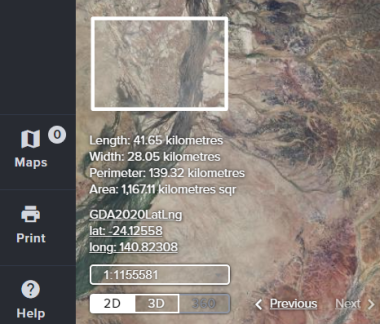
Click and drag to draw your rectangle on the map, certain measurements will be shown above the latitude and longitude (bottom left), and the rectangle will be added to Places.
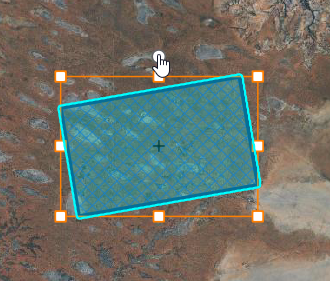
Navigating to Places and selecting Edit places allows you to edit your drawn rectangle after you select it.
Clicking on any of the corner vertices will allow you to change the size, or the centre square to rotate the rectangle.
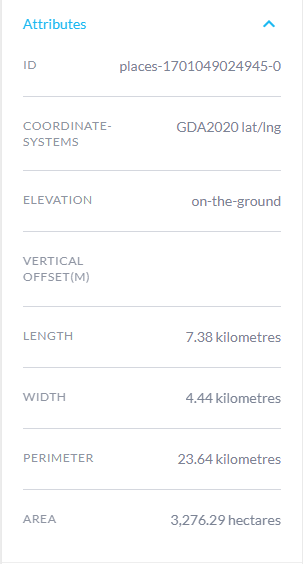
Any changes to the rectangle can be found under its attributes.
Draw and edit a line
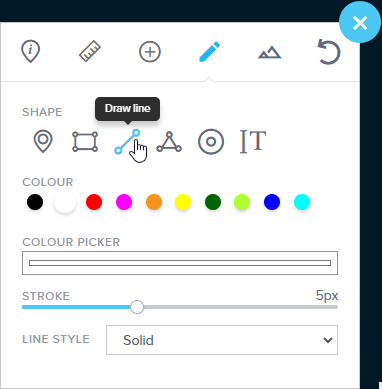
Select draw line from the list of options.
Before you click to draw, you can change options for the line colour and stroke width.
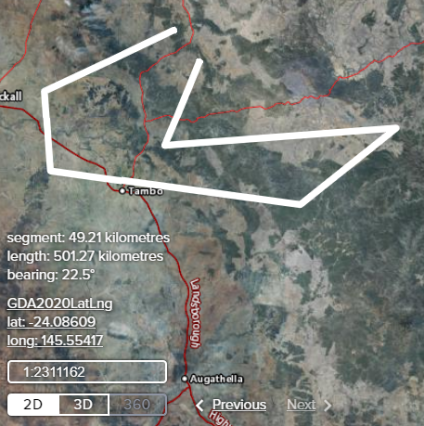
Click a start point for the line to begin, click again to create a line segment, click, and drag to draw freehand, double click to stop drawing, and the line will be added to Places. Certain measurements will be shown above the latitude and longitude (bottom left).
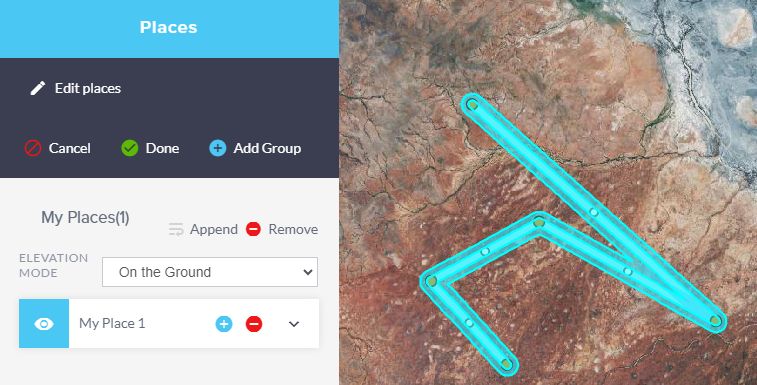
Navigating to Places and selecting Edit places allows you to edit your drawn line after you select it.
Clicking and dragging on any of the vertices along the line will allow you to change the line direction or distance and clicking directly on the line will create a new vertex at the specified point.
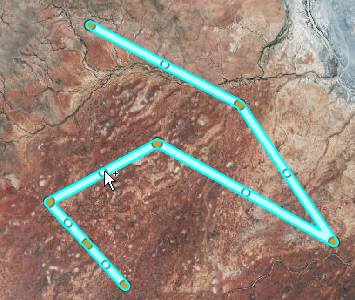
Any changes to the line properties can be found under its Attributes
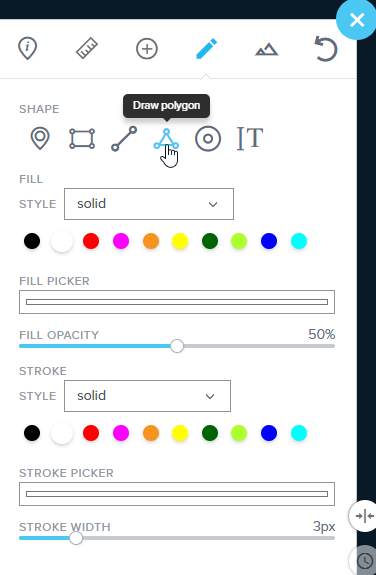
Draw and edit a polygon
Select draw Polygon from the list of options. Before you click to draw, you can change options for the fill colour and opacity, as well as the stroke colour and width.
Click a start point for the polygon to begin, click again to create a vertex, click, and drag to draw freehand, double click to stop drawing, and the polygon will be added to Places. Navigating to Places and selecting Edit places allows you to edit your drawn polygon after you select it.
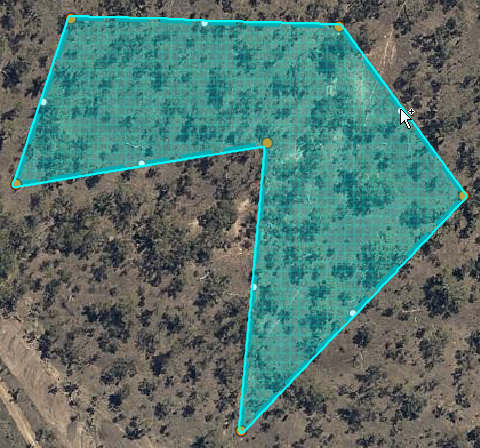
Clicking and dragging on any of the vertices along the polygon will allow you to change the line direction or distance and clicking directly on the polygon segment will create a new vertex at the specified point.
Any changes to the polygon properties can be found under its Attributes.
Draw and edit a circle or ellipse
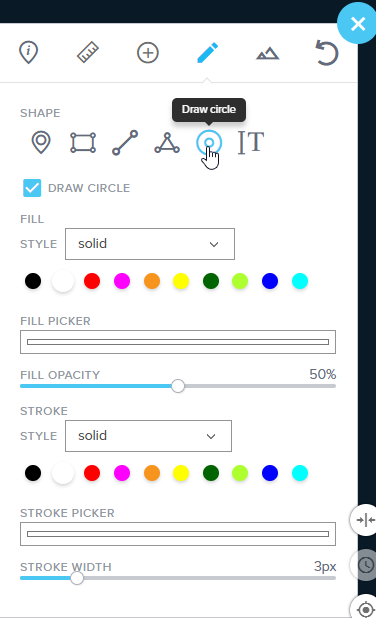
Select Draw circle from the list of options. Before you click to draw, you can change options for the fill colour and opacity, stroke colour and width. If you wish to draw an ellipse instead, turn off the checkbox labelled "Draw Circle".
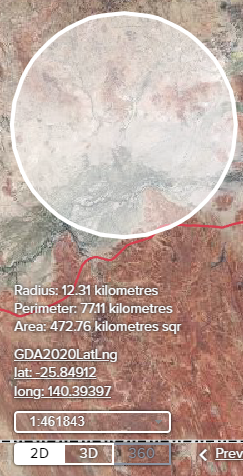
Click and drag to draw your circle on the map, certain measurements will be shown above the latitude and longitude (bottom left), and the circle will be added to Places.
Navigating to Places and selecting Edit places allows you to edit your drawn circle after you select it.
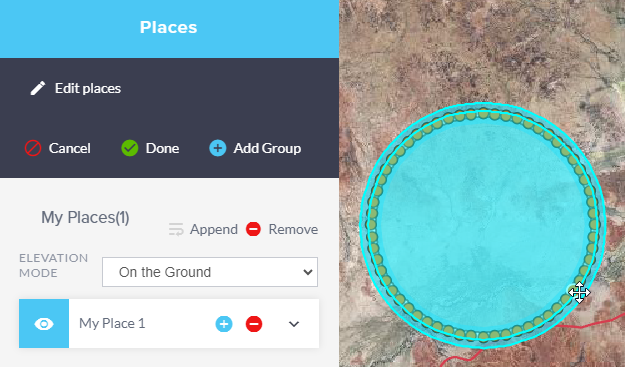
Clicking on the vertex will allow you to change the size of the circle and clicking inside the shape allows you to move it to a new location. Any changes to the circle properties can be found under its Attributes.
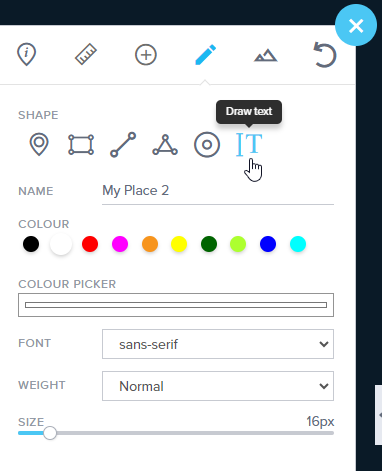
Draw and edit text
To begin drawing, select Draw text from the list of options. Before you click to draw, you can change options for the text colour, font, text weight, size and edit the text content.
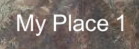
Click a point on the map, the text will be placed at that point, and the text will also be added to Places.
Navigating to Places and selecting Edit places allows you to edit the text after you select it.
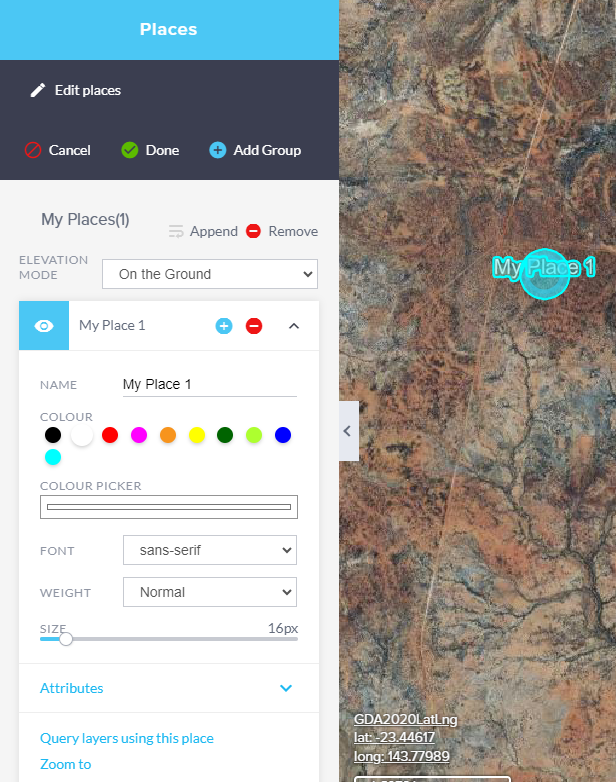
Note: editing the colour, font, weight, and name of text is undertaken separate to the Edit places tool. Attributes can also be seen under Places and give basic information about its location.
Label places and imported data
Adding label to a place
Expand the place that you want to label.
Select the Add label to map checkbox to include a label for that place.
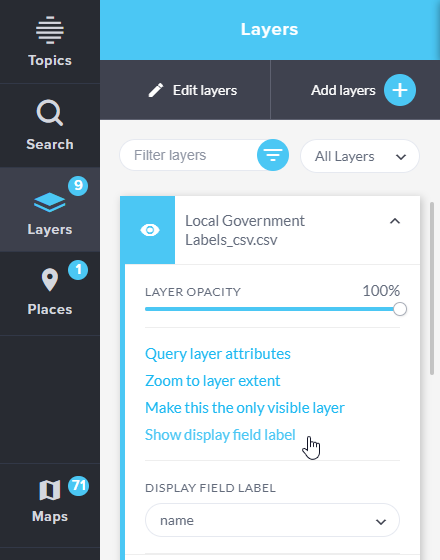
Adding label to user added data layers
Expand the user-added data layer
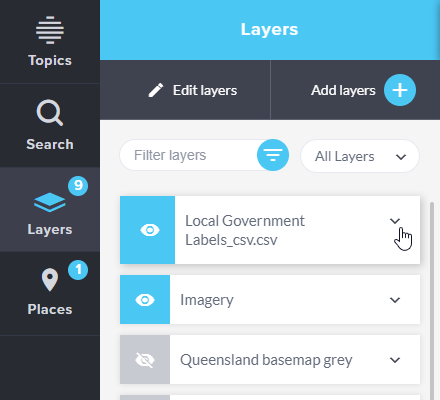
Specify the Display field label you want to use.
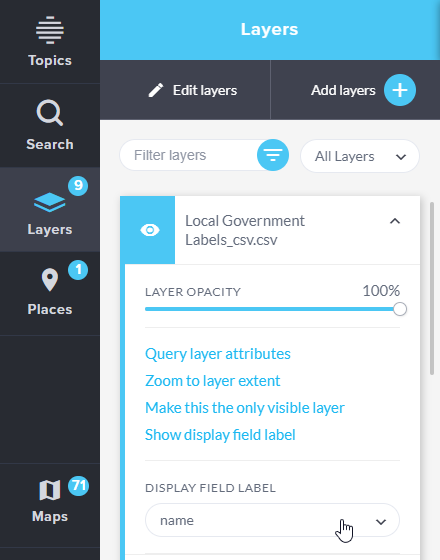
Then select Show display field label.
Colour picker
Adding a colour picker tool to the draw tools is a valuable feature for allowing users to apply custom colours when drawing. This option can make the drawing process more versatile and creative, particularly when creating maps or other visual content where colour customization is important. Users can now select and use their preferred colours to make their drawings more engaging and personalized.
Where is the colour picker available?
Users can now define custom fill and outline colours for polygons and points, as well as stroke colours for polylines. This level of colour customization enhances the versatility and creativity of the drawing process, making it easier for users to create engaging and personalized visual content.
The colour picker tool extends the colour options available for places in Queensland Globe without replacing the standard colour palette. It provides users with greater flexibility and choice while working on their maps. The ability to temporarily add custom colours to the standard palette for the session is a practical way to maintain consistency within a project while allowing for creative exploration.
The process of replacing a previously chosen custom colour with a new one using the colour picker also ensures that users can easily refine and adapt their colour choices as needed during their work session. This level of control and convenience can enhance the user experience and streamline the design process when drawing places.
The colour picker tool allows users to select and apply custom colours when drawing features in the Queensland Globe.
General guidelines for using the colour picker tool
- Access the Drawing tools via the toolbar.
- Choose the type of feature to be drawn, such as point, line or polygon.
- Look for the option to set the colour of your feature. This may be labelled as Fill Picker, Stroke Picker or Colour Picker.
- Click on the bar to open the colour picker options.
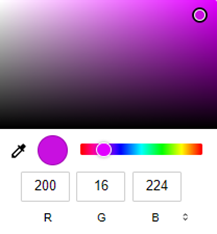
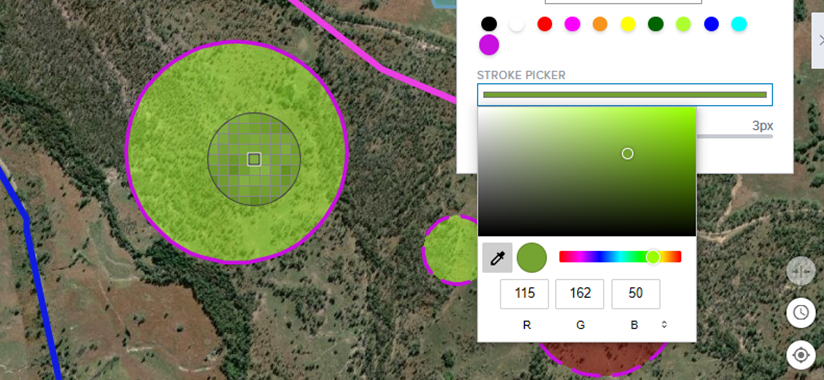
- Using the colour picker you can choose a colour in one of several ways:
- Click on a point within the colour spectrum.
- Specify RGB (Red, Green, Blue) values to define the custom colour.
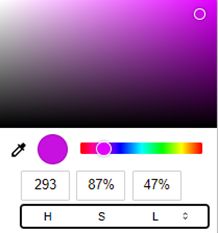
- Specify HSL (Hue, Saturation, Lightness) values to define the custom colour.
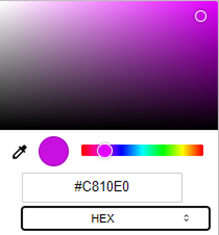
- Enter a HEX code to define the custom colour.
- Use the eye dropper to define the custom colour.
- The RGB, HSL and HEX code options can be toggled through by selecting the button at the bottom of the colour picker tool.
- Please note that there may be user-interface variations depending on the device/browser used.
- Once you have chosen the desired colour, a new colour dot will be temporarily be added to the standard colour palette for use within your current session.
- Users can add only one custom colour at a time to the standard colour palette using the colour picker tool.
- Custom colours assigned to places will be preserved if saved to a map or printed.
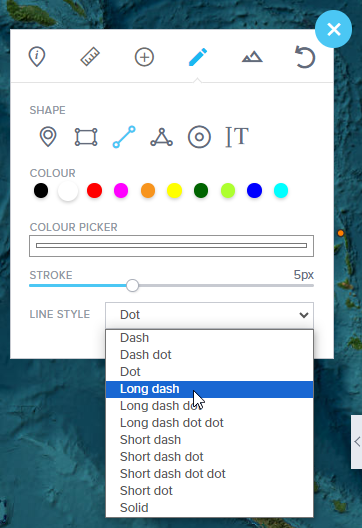
Line style
The ability to select different line styles provides greater flexibility for the presentation of your maps. When using the drawing tools or editing places, there is now a drop-down menu available to provide a selection of line styles. To apply a specific line style to a line or the outline of a polygon, simply click on the line style option in the drop-down menu. The styling applied to places can be saved to a map or incorporated in a print.
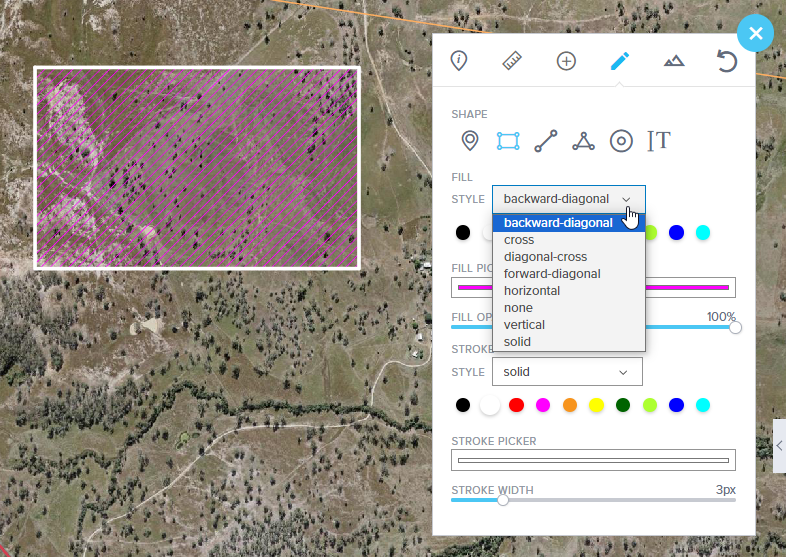
Fill style
Fill styles can be applied to polygon features in Queensland Globe. This allows users to customise the appearance of the interior of polygons, providing a variety of options for visual representation. When working with polygon features using the drawing tools, users can access a drop-down menu to choose from a selection of fill styles. The ability to apply fill styles to polygon features adds another layer of customisation and flexibility in map creation. This is particularly useful for conveying different types of information or highlighting specific areas on the map.
Styling limitations
- Outline style (Polygons) and Polyline style - unable to be displayed in legend. It will retain the colour but the style will not be displayed in the map legend. This also occurs on the print.
- Polygon fill style and polyline style is not retained when downloaded to SHP, KML, JSON. When re-imported it displays the default fill and line style.